

Telemetry, Data & Claude MCP
Turn Telemetry Into Decisions You Trust
DiraForge is a Nairobi team that builds the pipelines, Grafana and Spotfire dashboards, and Claude MCP integrations that turn sensor, network and platform data into clear answers, delivered as code you own.
Core Platforms
Pipeline Stages

What We Provide
Telemetry Pipelines
Grafana Monitoring
Spotfire Analytics
Claude & MCP
Engagement Stages
How we work
We Make Telemetry Easy To See, Trust And Act On
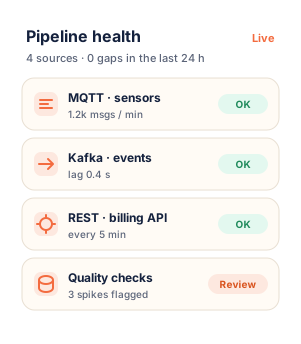
Most teams already collect more data than they can use. Readings sit in historians, logs pile up on servers and the weekly report is still assembled by hand. We connect those sources into one reliable pipeline, then put Grafana on the live picture, Spotfire on the deeper questions and Claude on the questions nobody thought to chart.
Every engagement follows four stages: discovery, a pilot on real data, a production build and a handover your team can run without us.
Grafana, Spotfire and Claude
Proven, open tooling
Spotfire · Grafana · Claude MCP
What we actually ship
Solutions We Deliver For Telemetry And Data Teams
- Industrial & IoT
- Telecom & Fintech
- IT & DevOps
- Enterprise Analytics
Equipment and energy data your teams can actually read
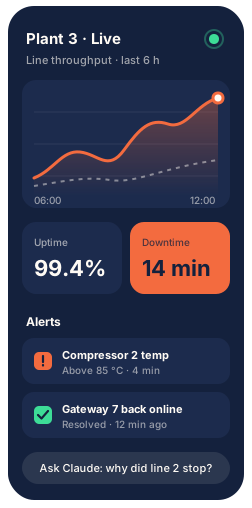
We bring PLC, sensor and gateway readings into live Grafana boards for equipment health, downtime and energy use. Night shifts see a fault as it starts, and the morning meeting opens with facts instead of exported spreadsheets.
-
Equipment and downtime boards
-
Energy and consumption tracking
-
Alerts routed to the right shift

Service and transaction monitoring that holds up
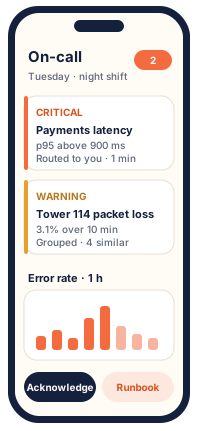
Throughput, failures and latency for networks, payments and mobile money in a single view. Clear alert rules mean operations spot a problem before customers call, and every incident leaves a timeline you can review.
-
Throughput, failure and latency views
-
Low-noise alert rules
-
Incident timelines for review

Infrastructure and SLO views your engineers trust
Prometheus metrics and logs behind Grafana dashboards, with alert routing and on-call schedules designed to cut noise instead of adding it. Everything is provisioned as code, so every environment stays consistent.
-
SLO and error-budget dashboards
-
Alert routing and on-call rotas
-
Dashboards and alerts as code

Spotfire analysis for the why behind the numbers
Governed KPIs and interactive drill-downs for analysts and management, built on the same data your operations teams watch live. Ask a new question without waiting weeks for a new report.
-
Interactive Spotfire analysis
-
Governed KPI scorecards
-
Claude briefs on the same data

Why Choose Us
Tested Against Your Real Data
Every pipeline is validated on your own sources and edge cases, before a dashboard or an alert depends on it.
Engineers, Not Account Managers
You work directly with the people building your system, from the first discovery call through to handover.
Delivered as Code, Owned by You
Pipelines, dashboards, alert rules and MCP servers land in your repository with runbooks, so your team can run them without us.

FAQs
Questions we actually get
Most projects start with a discovery call and a fixed-price pilot. Once we know your data sources, the questions you need answered and when you need results, we quote the production build in stages, so you only commit to the next step once the previous one has proved its value.
A typical pilot puts live data from one or two sources on a working dashboard within a few weeks. The exact timeline depends on access to your systems and how clean the data is, and we agree it with you before work starts.
No. We build around what you already run, whether that is a historian, a warehouse, Prometheus or Excel exports, and add Grafana, Spotfire or Claude only where they clearly help. Nothing gets ripped out for the sake of a new logo.
The Model Context Protocol is an open standard that lets Claude call tools and read data in a controlled way. We build MCP servers that expose only the data and actions you approve, follow your existing permissions and log every call for review.
Claude starts read-only and sees only the tools you approve, one at a time. Credentials stay on your side, every call is logged, and any action that changes something requires a person to approve it first.
Start with one painful question, such as unplanned downtime or failed transactions. We put real data on a real dashboard in a pilot, measure whether it answers that question, and then scale what works.
You do. Pipelines, dashboards, alert rules and MCP servers are delivered as code in your repository, with documentation, runbooks and training, so your team can run and extend them after handover.

A pilot
What a pilot looks like
We don’t publish client names unless that client has asked us to. A pilot is how you judge the work: one question, your data, a board you can read, and the code left in your repository.
- 1
One question
You bring the chart or the number nobody trusts. On the discovery call we agree the question, the sources, and what a useful answer would change.
- 2
Your data, on a real board
A fixed-price pilot puts one or two of your sources on a Grafana or Spotfire board, usually within a few weeks. You see your own data, not a demo.
- 3
You keep what we build
If the board answers the question, we quote the next stage. Pipelines, dashboards, alerts and MCP servers are delivered as code in your repository, with a runbook.
Discovery Call
Bring the awkward chart. We’ll look together.
Tell us what you want to see in your telemetry and where that data lives today. An engineer from our Nairobi team will reply with a few clarifying questions and suggest a time for a short discovery call. No sales script, no obligation.
Call us
Send Us Email
Got a messy dataset?
Tell us the painful question. We’ll start there, and show you what a pilot on your own data would look like.